Make Smarter Business Decisions
Our powerful analytics and reporting tools transform your raw data into actionable insights. Track performance, identify trends, and make informed decisions to drive growth and profitability. With customizable dashboards, automated reports, and real‑time visibility, you’ll gain a clear understanding of every aspect of your business. From uncovering hidden opportunities to minimizing risks, our system empowers leaders to act with confidence, optimize operations, and stay ahead in a competitive market
Key Benefits
- Real-Time Dashboards: Monitor key metrics as they happen
- Custom Reports: Create reports tailored to your business needs
- Predictive Analytics: Forecast sales and inventory needs
- Performance Benchmarks: Compare against industry standards
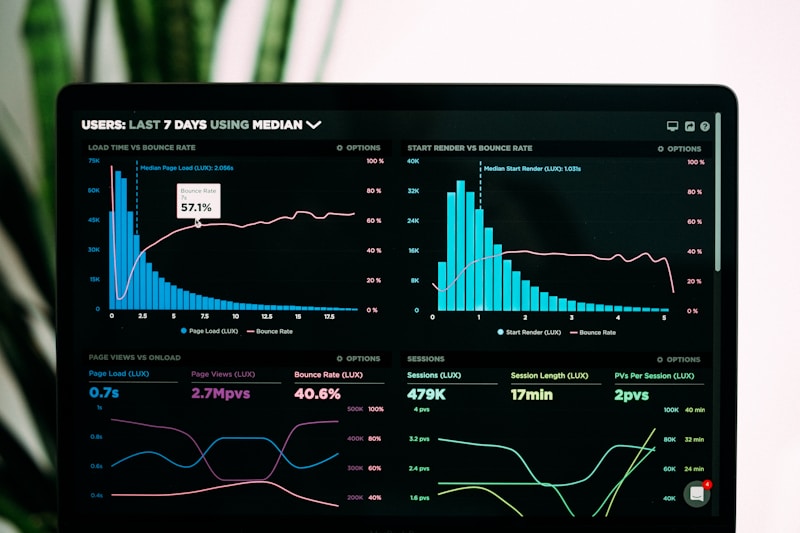
Dashboard Overview
Sales Dashboard
Track sales performance in real-time with visual charts and graphs. Monitor daily, weekly, and monthly trends to identify patterns and opportunities.
- Real-time sales tracking
- Product performance metrics
- Category analysis
Financial Dashboard
Monitor your financial health with detailed revenue, profit, and expense tracking. Get a complete picture of your business's financial performance.
- Revenue and profit tracking
- Expense analysis
- Payment method breakdown
Inventory Dashboard
Keep track of stock levels, turnover rates, and inventory value. Identify slow-moving items and optimize your inventory management.
- Stock level monitoring
- Turnover analysis
- Reorder alerts
Customer Dashboard
Understand your customer base with detailed analytics on demographics, behavior, and lifetime value. Track retention and acquisition metrics.
- Customer acquisition tracking
- Retention analysis
- Lifetime value calculation
Advanced Analytics
Predictive Analytics
Use machine learning to forecast sales, inventory needs, and customer behavior. Make proactive decisions based on data-driven predictions.
Cohort Analysis
Track customer groups over time to understand retention patterns and the long-term value of different customer segments.
Market Basket Analysis
Discover which products are frequently purchased together. Optimize product placement and create effective bundle offers.
Custom Report Builder
Report Features
- Drag-and-Drop Interface: Build reports without technical skills
- Custom Fields: Include the data points that matter to you
- Visualizations: Choose from charts, graphs, and tables
- Scheduled Reports: Automatically generate and send reports
- Export Options: PDF, Excel, CSV, and more
Popular Report Templates
- Sales by Product: Top and worst performing items
- Hourly Sales Analysis: Identify peak business hours
- Employee Performance: Sales and productivity metrics
- Customer Segmentation: Break down your customer base
- Profit Margins: Identify most profitable products/services
Industry-Specific Analytics
Restaurant
Table turnover rates, menu item profitability, server performance, and peak hour analysis.
Retail
Sales per square foot, category performance, seasonal trends, and promotion effectiveness.
Salon & Spa
Service profitability, client retention, staff utilization, and appointment patterns.
Data Integration & API
Third-Party Integrations
Connect with your favorite business tools for a complete view of your operations. Import data from accounting software, e-commerce platforms, and more.
- Accounting software integration
- E-commerce platform sync
- Marketing tool connections
API Access
Access your data through our robust API. Build custom integrations, connect with business intelligence tools, or create custom applications.
- RESTful API
- Webhook support
- Developer documentation